Category: Blog

We discussed earlier how to maximize the energy saving by relacing an old chiller in retrofit projects but in the these projects you are stuck with the existing chilled water system and the limited spaces in the building and you need to find ways to improve the existing system with the constraints available on site. On contrary, for new projects, you have the privilege to design and specify efficient chiller system from early stages and you can compare and analyse different system options and select the one that has the best life cycle cost.

In this article we discuss some ways to improve the efficiency of the chiller system during the design stage, however, the designer should analyse the designed system in a holistic approach to make sure they select the best system that meets the project budget and achieve the best possible efficiency.

  • Chiller:

As we mentioned earlier in our previous article, the chiller should be high efficiency variable speed chiller with magnetic bearing compressors are the best. Air cooled chillers should have EC fans for the condenser and should be equipped with adiabatic system to improve their efficiency further.

  • Chiller Leaving Chilled Water Temperature:

The chiller efficiency depends on the compressor lift, which is the difference between the suction and discharge pressures. The smaller the difference in pressures the higher the efficiency of the chiller. The pressure is proportional to the temperature and therefore, the compressor lift and then the chiller efficiency depends on the leaving chilled water temperature and the leaving condenser water temperatures for the water cooled chillers or the leaving air temperature for the air cooled chillers.

Based on the above, we can see that increasing the leaving chilled water temperature from the chiller will improve its efficiency. As a rule of thumb, for every 1°C increase in leaving chilled water temperature, there is 3% reduction in chiller energy consumption. Therefore, always design your system with high leaving chilled water temperature. Note that increasing the chilled water temperature leads to bigger coils in the AHU’s and FCU’s and therefore, the designer should carry out life cycle cost analysis to select the optimum system.

The designer should also consider selecting chilled beams or displacement diffusers for the chilled water system because these types of systems require higher chilled water supply temperature that can reach 16°C. This high chilled water temperature allows you to select smaller chillers and in the same time improve the chiller efficiency.

  • Reducing Pumps Flow Rate:

Most of the engineers design the chiller system at 5°C delta T on both the chilled water side and also on the condenser side if the chiller is water cooled. This is the old way to design the system but due to the need for energy efficiency, we need to increase delta T to 8 – 10°C to reduce the flow rate so we can select smaller pumps and save in the pumping energy. Further, reducing the condenser water flow rate for the water cooled chillers, will leads to smaller cooling tower and smaller tower fan, which also reduce the energy consumption further. Not to forget to mention that reducing the water flow rates leads to select smaller pipes, which reduces the capital cost of the project.

  • Water Cooled Chillers Connection Configuration:

We still see in most of the projects the water cooled chillers connection is parallel, while there is another configuration that makes these chillers more efficient specially for the large capacity chillers.

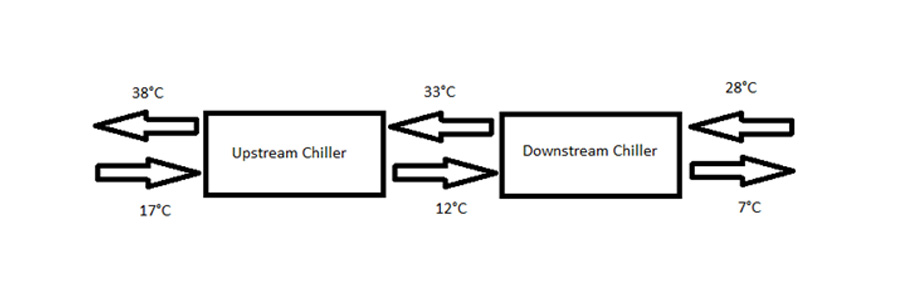
Series counter-flow chillers configuration as shown in the figure below reduces the chillers lift and improves their efficiency. You can see from the figure below that the chiller that has lower leaving chiller water temperature has also the lower leaving condenser water temperature and vis versa. This configuration makes both chillers see approximately the same smaller lift (26°C) than seeing the bigger lift (31°C) if they are both connected in parallel. Chiller manufacturers claim that this configuration can improve the chiller efficiency by up to 13%.

  • Using Variable Speed Drives (VSD):

Motor energy consumption is proportional to the cube of the flow rate and therefore, reducing the water or air flow rate will reduce the energy consumption of pumps and fans drastically. Thus, the followings should be specified with VSD:

  • Chilled Water Pumps with emphasis on variable primary flow configuration, which saves on the initial and running costs.
  • Condenser Water Pumps
  • Cooling Tower Fans
  • Air Handling Units Fans
  • Using Pressure Independent Control Valves (PICV):

Using pressure independent control valve for the air terminal units such as FCU’s and AHU’s is much better than using the traditional combination of the 2-way control valve and balancing valve. The 2-way control valve change the flow rate supplied to the terminal unit based on the pressure difference between its ports. This means that many times this 2-way valve will allow more water flowrate to the terminal unit than what is required. This overflow reduces the return chilled water temperature to the chiller and causes what we call it low delta T syndrome. This reduces the chiller efficiency and leads to more chillers to run, which increase the chillers energy consumption and reduce the system efficiency. Further, this overflow makes the pumps run at higher speed to meet the required overflow, which also increases the pumps energy consumption.

On contrary, PICV maintains the required flow rate to the terminal units regardless what is the pressure difference between the two ports. Therefore, it eliminates the overflow to happen and make the system more efficient.

  • Thermal Storage Tanks:

Thermal storage tanks whether it is chilled water, ice or phase change material (PCM) can be used to shift the electricity demand from the peak time to other times to reduce the peak demand charges. However, these tanks occupy big area in the building and not always it is possible to accommodate them. The largest tank is the chilled water storage tank and the ice tank requires around 20% of the volume of the chilled water tank for the same thermal capacity, while the phase change material tank requires 50% of the volume.

The chilled water thermal storage tank is the easiest option to include in the design but because of its large volume, it is not always practical to include it.

The ice conductivity is low and requires low operating temperatures, which reduces the chiller efficiency and therefore, can be used for demand shifting but for energy efficiency, a more detailed analysis should be done to make sure that operating the chillers at low ambient temperature during the night for example will outperform the reduction in efficiency due to the low chilled water temperatures.

The most common material used for PCM tanks is Eutictics and this material has freezing point of around 8.3°C, which make it the best option to choose for chilled water systems to save energy, however, the size of the tanks still a challenge to include it in the building.

  • Controls:

The building management system (BMS) should be designed and specified well and should include energy efficiency control strategies to make the chiller system operation more efficient. Below are examples of energy efficiency control strategies that should be included in the BMS:

  • Chilled Water Temperature Setpoint Reset. Note that this strategy conflicts with the variable speed chilled water pumping strategy and therefore, it is more suitable for constant flow systems and for variable primary flow systems the precedence should be for the variable speed pumping and after the flow is at minimum, then the chilled water temperature setpoint reset should apply.
  • Condenser Water Temperature Setpoint Reset.
  • Optimum Start/Stop
  • Demand Limiting

Further, the designer should specify Chiller Plant Optimization Controller, which is a controller dedicated only for the chiller plant (chillers, cooling towers, pumps and valves) and has algorithms to optimize the planet water temperatures and flows to make sure the plant equipment operate at their maximum efficiency.

For an energy efficiency design review for your chiller system and other building services design to improve it and make it more efficient, then please contact us.

The peak demand is the maximum electrical power that happens over a specific period of time. The unit of the peak demand is KVA or kW and can be measured on daily, monthly or yearly basis.

The peak demand for a building or a facility is a network charge because it has an impact on the network infrastructure and it is a direct pass from the network provider to the end user through the energy retailer. It is usually measured daily, however, the energy retailer does not charge the clients for the measured daily demand but they charge for something called the Contracted Demand or the Critical Peak Demand.

The network provider usually calculates the contracted demand annually and it is based on the average of the peak demand in a nominated number of days in the year and during a specific period of time, which is usually between 2 to 6 pm (3 to 7 pm daylight saving time). Usually the energy retailer mentions the monthly peak demand in each monthly bill and therefore, the end user should monitor this monthly peak demand and compare it to the contracted demand in the bill to make sure it is not way lower than the later. It happened that one of our clients has 178 KVA contracted demand and the highest value of their monthly peak demand was only 66.9 KVA during the year. The client was paying for 178 KVA peak demand while they should only pay for 66.9 KVA. This is corresponds to around $900 saving per year. We spoke to the energy retailer on behalf of our client and they advised that they are happy to review the contracted demand again and reduce it and this is what we told our client to do.

How can we manage the peak demand and reduce it?

As we mentioned above, the peak demand is an electrical power and therefore, it is a result of using electrical systems and equipment in the building. For example, during hot days in summer, the air conditioning system works in its full capacity to meet the cooling load in the building and therefore, it makes a spike in the electricity consumption during the afternoon. Likewise, turning on all the lights in the building at the same time leads to increase the peak demand. Below, we discuss some strategies for each system to manage and reduce the peak demand:

HVAC (Heating, Ventilation and Air Conditioning) Systems:

  • Global Temperature Adjustment: You can raise the temperature setpoint for all the spaces in the building in summer and lower it in winter during the peak demand time to reduce the air conditioning system electrical power demand.
  • Supply Air Temperature Increase: You can increase the supply air temperature to reduce the load on the air conditioning units and chillers and then reduce their electric power demand.
  • Thermal Mass Storage: You can install energy mass storage such as chilled water thermal storage tanks or ice storage tanks to shift the chiller electric power demand from the peak demand time to low demand time such as during the night.
  • Duct Static Pressure Decrease: You can reduce the duct static pressure setpoint during the peak demand time to reduce the fans electric power demand.
  • Fan Variable Frequency Drive Limit: You can put a limit on the maximum frequency for the fans to reduce their speed and then reduce their electric power demand.
  • Chiller Demand Limiting: You can apply chiller demand limiting control strategies in the BMS to reduce chiller power demand during the peak demand time.

Lighting Systems:

  • Zone Switching: You can divide the building lighting into zones depending on the occupancy and working hours and you should only turn on the lights of the occupied zones and no need to turn all the building lights every time.
  • Stepped Dimming & Continuous Dimming: You can install dimers on the lights and consider dimming the lights during the peak demand time.

Solar PV System:

Consider to install solar PV system in the building to generate electricity and then reduce the electricity consumption and also the peak demand.

Other Systems:

  • Elevator Cycling: You can cycle between elevators and not turn them on all during the peak demand time.
  • Shift Load to Emergency Generator: You can use the emergency generator to meet part of the building electricity demand during the peak demand time.
  • Power factor correction: If you have low power factor in the building, then you can install power factor correction to reduce the apparent power and the peak demand.
  • Turn off Unnecessary Systems: You can turn off the unnecessary systems such as fountain pumps during the peak demand time.

For a comprehensive review for your energy consumption and your peak demand, which gives you recommendations and solutions to reduce both of them, please contact us.

The climate change and global warming are real and we need to take responsibility and try to preserve the environment for the coming generations. Therefore, every organization whether it is big or small should have energy efficiency plan in place to reduce its energy consumption and its carbon footprint. Many organizations are willing to do so but they don’t know where to start and what actions they need to take first and what steps they need to follow to achieve sustainable outcome.

We have prepared the following steps to guide any organization in preparing successful energy efficiency plan for sustainable outcome:

  • The first step is to assign an energy manager in the organization. This energy manager can be one of the organization employees who is interested in energy efficiency and energy management. This energy manager should be able to program the air conditioning thermostat, program timers and program computers and copiers for efficient operation. Provide him with training if required. This energy manager should train other staff on how to use the systems and equipment in the organization efficiently.
  • Prepare an energy efficiency policy for the organization and let it signed by the top management so it becomes part of daily activities and to make the staff commit to it.
  • Schedule energy audits, recommissioning and maintenance to the systems and equipment in the organization to make sure they are tuned for the best efficiency. The energy manager should prepare these schedules along with the maintenance staff.
  • Depending on your budget, work with your energy auditor on action plan and set realistic targets and arrange to implement the energy audit recommendations that have short payback period to give higher return on investment.
  • Set a yearly budget to implement energy audit recommendations and use the savings from the previous energy efficiency projects to fund new projects. Utilize the government grants and rebates to finance your energy efficiency projects.
  • Reward the staff who contribute to energy efficiency to encourage other staff to do so.
  • Provide training to the staff on how to use the systems and equipment in the organization in efficient way to reduce the energy consumption and CO2

If you need help in preparing your energy efficiency plan, don’t hesitate to contact AESS.

Solar hot water system is usually one of our recommendations to our clients to save energy and protect the environment. However, most of our clients complaining that the payback period for this system is long and has low return on investment. This is true but if you consider all the benefits of the solar hot water system, you can see that it is worth the investment and it make sense to have it in your property.

As we all know, the solar hot water system reduces the energy consumption and the energy bills because it uses the free energy from the sun, however, the solar hot water system has more benefits than only saving energy, which are listed below:

  • It uses renewable and secure source of energy because it depends on the sun for heating the water.
  • It is a reliable system that provides hot water year round. When the conventional gas or electric water heater is faulty, it will not provide you with any hot water. On contrary, the solar hot water system will provide you hot water whenever there is a sun in the sky.
  • It requires low maintenance because it has less moving parts. It has only circulating pump(s) for the large central system and it has no moving parts at all for the home system.
  • It reduces the maintenance cost compared to the conventional gas/electric water heater because it reduces the run time and the stress on the gas burner/electric element. This leads to longer service life of the system.
  • It protects the property owner from the increase in energy costs because it uses the free energy from the sun.
  • It is supported by the government because it is type of renewable energy and therefore, you might be eligible for government rebates that reduce your capital cost and make it more attractive investment.
  • It reduces your property carbon footprint because it reduces the greenhouse gases emissions.
  • It increases the value of your property.
  • It attracts the tenants to your property.

There are different types of solar collectors that are used in the solar hot water system but the most two popular types are flat plate and evacuated tubes. We always recommend evacuated tubes collectors to our clients even though they are more expensive for the following reasons:

  • Evacuated Tubes have better heat retention capabilities and generally more heat efficient.
  • It is easier for evacuated Tubes to replace one tube if it is damaged and no need to replace the entire collector like the flat plat type.
  • Evacuated Tubes don’t corrode easily.
  • Evacuated Tubes require less space on the roof than flat plate collectors.
  • Evacuated Tubes are lighter than flat plate collectors.
  • Evacuated Tubes work even in cold weather.
  • Evacuated Tubes produce hotter water than flat plate and therefore, produce more energy.

For a comprehensive review of your hot water system and an energy saving advice, don’t hesitate to contact AESS.

Increasing or decreasing the temperature setpoint in the thermostat of the heating and cooling equipment will affect the energy consumption of these equipment. For example, if you increase the temperature setpoint for a ducted heater or decrease it for an air conditioning unit, then the energy consumption of these equipment will decrease because the heat transfer rate between the inside and the outside of the building will also decrease.

That is true but how much you can save energy by adjusting the temperature setpoint in the thermostat. The rule of thumb says that typically by adjusting the temperature setpoint by 1°C as we described above, you will save around 10% of the energy consumption of the heating or cooling unit.

I wanted to verify this rule of thump and therefore, I put it to the test especially during COVID-19 pandemic, where we have been locked down in our homes for long periods of time and therefore, we have now more time to spend with our families and also we have time to do some research and experiments as well.

To verify this rule of thumb, I used the gas ducted heater in my home and I installed three temperature data loggers as follows:

  • Temperature data logger to measure the outdoor temperature with 1 minute interval
  • Temperature data logger next to the ducted heater thermostat to measure the room temperature with 1 minute interval and,
  • Temperature data logger to measure the supply temperature of the ducted heater with 1 minute interval.

The methodology I used to verify this rule of thumb and measure the energy saving of the ducted heater is as below and note that the heater was running 24 hours per day:

  • I set the temperature setpoint in the thermostat of the ducted heater at 20°C for day 1 (9th August, 2020).
  • I set the temperature setpoint in the thermostat of the ducted heater at 22°C for day 2 (10th August, 2020).
  • The data loggers were measuring the temperatures over the period of these two days from 6 am of the first day to 6 am of the third day.
  • I used the heater supply temperature to calculate the time when the heater was running because its supply temperature was high. When the supply temperature was low, this means the heater was off.
  • Because the heater in my home has constant burner and not modulating (i.e. on/off control), then the gas consumption is proportional to the heater running time and the difference in the heater running time in both days will reflect the energy saving due to temperature setpoint adjustment.

The graph below shows the temperatures measured by the three data loggers over the two days period:

We can note the followings from the graph above:

  • The outdoor temperatures in both days are close to each other but in the afternoon the outdoor temperature for day 2 is higher because it was a sunny day while day 1 was mostly cloudy. No wind in both days.
  • The heater supply temperature shows the oscillation pattern, which represents on/off control.
  • We can see that the heater in both days between 2 pm to 6 pm is almost off because the room temperature was above the temperature setpoint due to the warm weather ouside.
  • We can see that the thermostat maintained the room temperature equal to the temperature setpoint for some extent and the data is more consistent between 12 am to 6 am each day.
  • We can see that the heater supply temperature in day 2 is higher than day 1 and this is because the return temperature (i.e. room temperature) is higher.

As we mentioned above, the data is more consistent between 12 am to 6 am each day and this is because during this time, all my family was sleeping and no effect by sun on the home, which make it more accurate to calculate the running time of the heater in this period and then calculate the energy saving percentage between the two days. The table below summarizes the parameters and the heater running time for the two days:

Time Period

Average Outdoor Temperature (°C)

Average Room Temperature (°C)

Heater Running Time (Minutes)

Day 1 from 12 am to 6 am

7.69°C

19.87°C

148

Day 2 from 12 am to 6 am

8.39°C

21.86°C

171

The above table shows that the difference in average room temperature between the two days is 1.99°C and the percentage increase in heater running time for day 2 compared to day 1 is 16%. This is equal to around 8% per 1°C. Note that the average outdoor temperature of day 2 is higher than the average outdoor temperature of day 1 by 0.7°C and if the outdoor temperature in day 2 was equal to the outdoor temperature in day 1, then the percentage might increase to 9% or more.

Based on the above discussion, we conclude in our opinion that the rule of thumb of 10% increase/decrease in energy consumption of the heating and cooling equipment per each 1°C setpoint adjustment is for some extent correct.

Energy Saving Opportunities:

Whenever there is energy monitoring and comfort monitoring in the building, there is always energy saving opportunities identification and improvement. For example, when we look at the graph above and in particular between 10:30 am and 12:00 pm in day 2, we can see that the heater is running for longer time while the room temperature is way more than the temperature setpoint. This is for sure energy wastage and need to be investigated and remedied. What I can say is that during this period of time, my wife was cooking in the kitchen with the stove and the range hood fan were running. This might led to turbulences and cold draught over the thermostat especially it is located close to the outside door. It might not be the optimum location for the thermostat but I learned from this temperature monitoring to turn off my ducted heater during the cooking time to save gas and cut any energy wastage but in the same time maintain the comfort room temperature.

If you are after saving energy in your home or your facility, please don’t hesitate to contact AESS to monitor your energy and comfort temperatures and provide you with ways and solutions to reduce your energy consumption and your energy bills.