
How Much Can You Save Energy by Adjusting Your Thermostat by 1°C?
Increasing or decreasing the temperature setpoint in the thermostat of the heating and cooling equipment will affect the energy consumption of these equipment. For example, if you increase the temperature setpoint for a ducted heater or decrease it for an air conditioning unit, then the energy consumption of these equipment will decrease because the heat transfer rate between the inside and the outside of the building will also decrease.
That is true but how much you can save energy by adjusting the temperature setpoint in the thermostat. The rule of thumb says that typically by adjusting the temperature setpoint by 1°C as we described above, you will save around 10% of the energy consumption of the heating or cooling unit.
I wanted to verify this rule of thump and therefore, I put it to the test especially during COVID-19 pandemic, where we have been locked down in our homes for long periods of time and therefore, we have now more time to spend with our families and also we have time to do some research and experiments as well.
To verify this rule of thumb, I used the gas ducted heater in my home and I installed three temperature data loggers as follows:
- Temperature data logger to measure the outdoor temperature with 1 minute interval
- Temperature data logger next to the ducted heater thermostat to measure the room temperature with 1 minute interval and,
- Temperature data logger to measure the supply temperature of the ducted heater with 1 minute interval.
The methodology I used to verify this rule of thumb and measure the energy saving of the ducted heater is as below and note that the heater was running 24 hours per day:
- I set the temperature setpoint in the thermostat of the ducted heater at 20°C for day 1 (9th August, 2020).
- I set the temperature setpoint in the thermostat of the ducted heater at 22°C for day 2 (10th August, 2020).
- The data loggers were measuring the temperatures over the period of these two days from 6 am of the first day to 6 am of the third day.
- I used the heater supply temperature to calculate the time when the heater was running because its supply temperature was high. When the supply temperature was low, this means the heater was off.
- Because the heater in my home has constant burner and not modulating (i.e. on/off control), then the gas consumption is proportional to the heater running time and the difference in the heater running time in both days will reflect the energy saving due to temperature setpoint adjustment.
The graph below shows the temperatures measured by the three data loggers over the two days period:
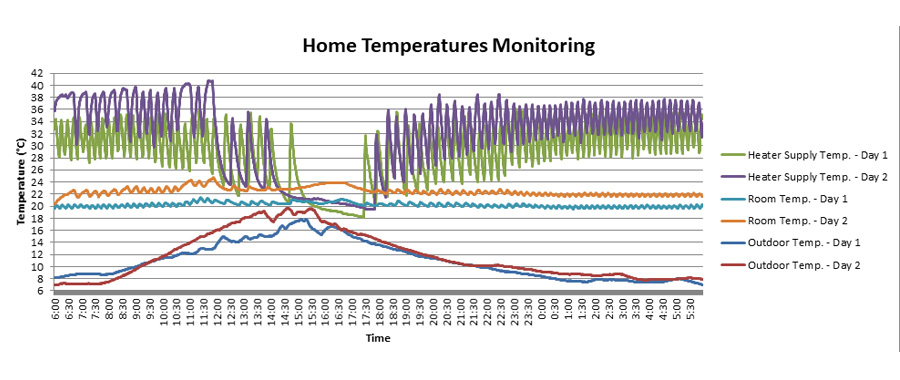
We can note the followings from the graph above:
- The outdoor temperatures in both days are close to each other but in the afternoon the outdoor temperature for day 2 is higher because it was a sunny day while day 1 was mostly cloudy. No wind in both days.
- The heater supply temperature shows the oscillation pattern, which represents on/off control.
- We can see that the heater in both days between 2 pm to 6 pm is almost off because the room temperature was above the temperature setpoint due to the warm weather ouside.
- We can see that the thermostat maintained the room temperature equal to the temperature setpoint for some extent and the data is more consistent between 12 am to 6 am each day.
- We can see that the heater supply temperature in day 2 is higher than day 1 and this is because the return temperature (i.e. room temperature) is higher.
As we mentioned above, the data is more consistent between 12 am to 6 am each day and this is because during this time, all my family was sleeping and no effect by sun on the home, which make it more accurate to calculate the running time of the heater in this period and then calculate the energy saving percentage between the two days. The table below summarizes the parameters and the heater running time for the two days:
|
Time Period |
Average Outdoor Temperature (°C) |
Average Room Temperature (°C) |
Heater Running Time (Minutes) |
|
Day 1 from 12 am to 6 am |
7.69°C |
19.87°C |
148 |
|
Day 2 from 12 am to 6 am |
8.39°C |
21.86°C |
171 |
The above table shows that the difference in average room temperature between the two days is 1.99°C and the percentage increase in heater running time for day 2 compared to day 1 is 16%. This is equal to around 8% per 1°C. Note that the average outdoor temperature of day 2 is higher than the average outdoor temperature of day 1 by 0.7°C and if the outdoor temperature in day 2 was equal to the outdoor temperature in day 1, then the percentage might increase to 9% or more.
Based on the above discussion, we conclude in our opinion that the rule of thumb of 10% increase/decrease in energy consumption of the heating and cooling equipment per each 1°C setpoint adjustment is for some extent correct.
Energy Saving Opportunities:
Whenever there is energy monitoring and comfort monitoring in the building, there is always energy saving opportunities identification and improvement. For example, when we look at the graph above and in particular between 10:30 am and 12:00 pm in day 2, we can see that the heater is running for longer time while the room temperature is way more than the temperature setpoint. This is for sure energy wastage and need to be investigated and remedied. What I can say is that during this period of time, my wife was cooking in the kitchen with the stove and the range hood fan were running. This might led to turbulences and cold draught over the thermostat especially it is located close to the outside door. It might not be the optimum location for the thermostat but I learned from this temperature monitoring to turn off my ducted heater during the cooking time to save gas and cut any energy wastage but in the same time maintain the comfort room temperature.
If you are after saving energy in your home or your facility, please don’t hesitate to contact AESS to monitor your energy and comfort temperatures and provide you with ways and solutions to reduce your energy consumption and your energy bills.